
Find out how much water and power your place can give.

For any place on Earth, Droply shows how much water rain, fog and air can give there, how much solar power a system needs for it and what it costs – compared with tap water.

Free, no sign-up. A first estimate from climate data – measure on site before you buy.

Drag to rotate · tap a pointSwipe to rotate · tap a point
0 mm≥ 2,500 mm per year
ERA5 (Copernicus) · mean 2011–2025

See in the VR room →

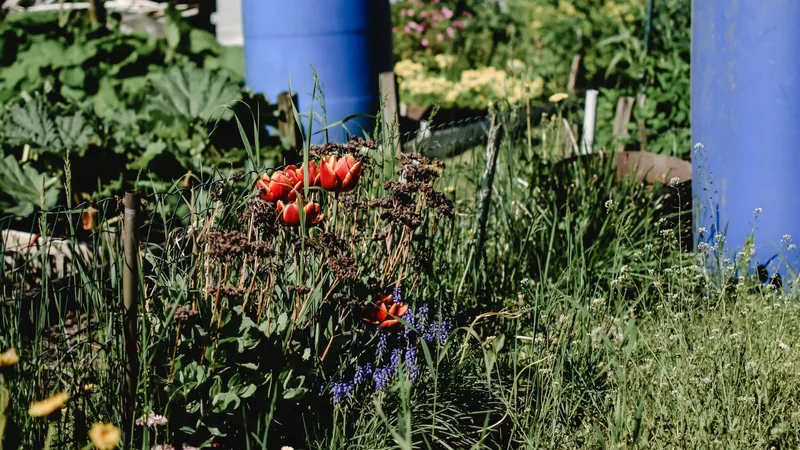
What a result looks likeMannheim, Germany · Watering a community garden

See the setup ↓
  • about 50 L/daywater, yearly average
  • about €550to buy the building blocks
  • 100 %of the goal of 50 L/day

Litres: average over the year – less in dry months, more in wet ones, a tank evens it out. Prices: guide values incl. VAT, as of September 2026, excluding installation, maintenance and running costs.

How it works

  1. Choose a place

    Search for your place or tap it on the map.

    Choose a place →
  2. See the result

    You see how much rain, fog, humid air and sun come together there, which building blocks work and roughly what they cost.

  3. Change the numbers

    In the builder you put your system together yourself: bigger tank, swap rain for fog, more solar power – the result changes straight away.

The setup behind itThe same place as above, drawn and calculated as in the builder.

Rainwater harvesting · Water tank

Open this example →
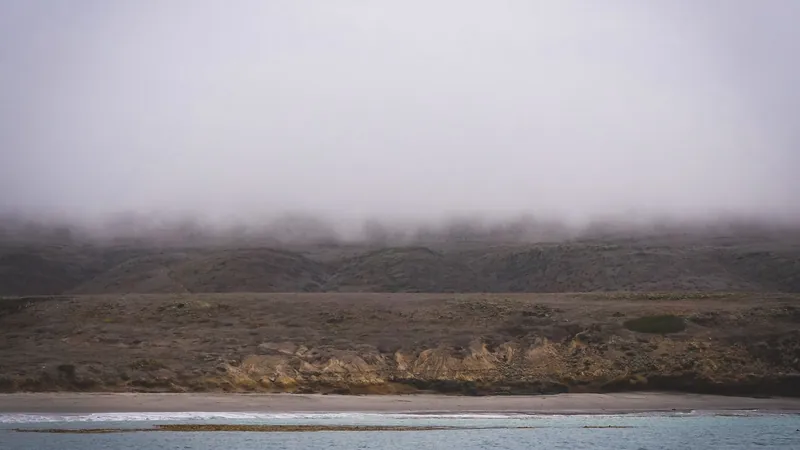
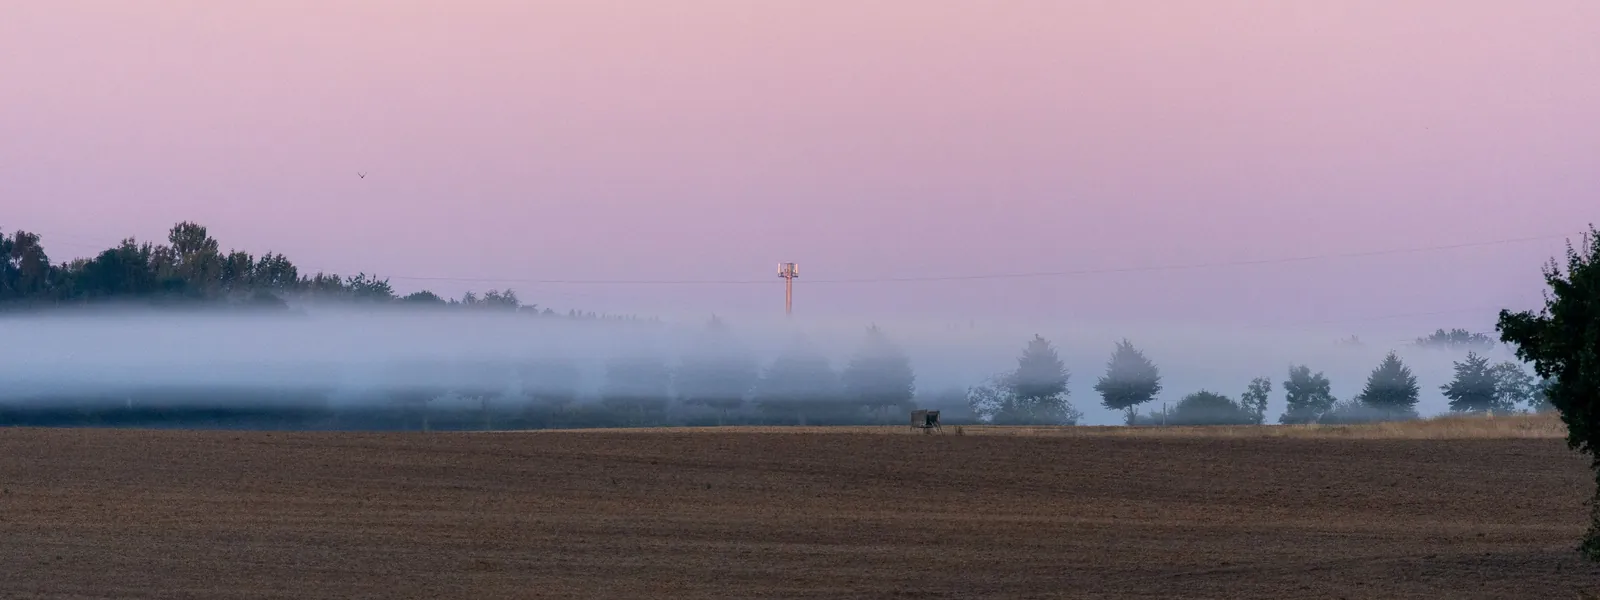
Fog over fields at dawn · Photo: Rickie-Tom Schünemann · Pexels

Three ways to water

Rain · Fog · Air

Tap to shade the globe by it.

What do you think: how much water does a person in Germany use per day?

Try it yourself

Hold two places against each other or work out how big a roof would need to be – with the same climate values as the map.

Place duel

Loading climate data …

Values of the 0.5° grid cell, mean 2011–2025 – the same as on the map.

Roof calculator

Loading climate data …

From rain to the glass

This is how the parts in the builder fit together. Drinking water always needs treatment – wherever the water comes from.
  1. SourceRain, fog or humidity
  2. CollectRoof, net, gutter
  3. Tankbridges dry days
  4. Filterholds back particles
  5. Mineralsrainwater is very soft
  6. UV-Ckills germs with UV light
  7. Tapdrinking water

What's in the builder?

Hover over a module or tap “i” to see what it is and what it depends on.
  • Passive water source

    Rainwater harvesting

    A roof or other surface collects rainfall and channels it into a tank. No rain, no water – but also no electricity.

  • Passive water source

    Fog net

    A mesh hung vertically; fog droplets catch on it and run down into a gutter. Only works where fog passes through regularly.

  • Active water source

    Atmospheric water generator (condensation)

    A machine that draws in air and cools it until the water in it condenses – like on a cold bottle. Needs warm, humid air and a lot of electricity.

  • Storage

    Water tank

    A container that bridges the days when nothing comes in. Without storage the best source is useless the moment it pauses.

  • Treatment

    Activated carbon filter

    Carbon with a huge internal surface binds odour, taste, chlorine and organic compounds. Removes neither germs nor salts.

  • Treatment

    UV-C / bacteria filter

    Short-wave light destroys the genetic material of bacteria and viruses as the water flows past. Works only on clear water and removes no chemicals.

  • Energy

    Plug-in solar (balcony)

    One to four solar panels with a plug, on a railing or terrace. Feeds at most 800 W into the home and can be connected without an electrician (Germany).

  • Use

    Drip irrigation

    Hoses deliver water drop by drop straight to the root. Loses far less to evaporation than watering or sprinkling.

All modules in the builder →

What you can use Droply for

At home · At school · In organisations

What you want to know first

Does Droply cost anything? Do I have to sign up?

No and no. The map, the builder and the examples are free to use – no account, no sign-up.

How accurate are the figures?

Good enough for a first estimate, not for a building plan. The climate figures are averages over cells of about 50 × 50 km for the years 2011 to 2025; a valley or a coastline can differ considerably. A real installation needs measurements on site and a check by a professional.

Where does the data come from?

Climate figures: ERA5, the climate reanalysis of the EU’s Copernicus Earth observation programme – calculated from measurements and weather models. Places: Natural Earth and GeoNames. Prices in the builder: reference values from common online offers, as of September 2026 – not quotes. Every source, assumption and known weakness is listed on the “Sources & method” page.

See sources and method →

Why is tap water so cheap?

Because many people work on it every day: waterworks, pipes and treatment plants. On average a person in Germany uses 122 litres a day (BDEW, 2024). 1,000 litres of drinking water cost €2.06 on average, €4.77 including wastewater (Destatis, 2025). Depending on where you live it can be much more or less.

See reference figures and sources →

Can I buy a system from Droply?

Not yet. Droply calculates and explains; the prices in the builder are reference values, not offers from us. If you would like to hear when that changes, write to us via the contact form.

Send a message →

Is what I enter stored?

The calculation runs in your browser and is not transmitted. The map loads map tiles from OpenFreeMap, which sees your IP address. For “Weather now”, the coordinates, rounded to about one kilometre, go to our server. Your settings and drafts stay in your browser. The only thing stored is what you send yourself through a form.

How can I report a mistake or suggest something?

Via the contact form. Tell us which page and which place you noticed it on.

Go to the contact form →

Try it for your own place.

Find my place